Here are my forex trading results from this week:
Week 4 (5/19 to 5/23): -127 pips
Total to date: -292 pips
Results by pair for the week: GBP/USD down 127 pips, USD/JPY down 30 pips, EUR/JPY up 90 pips, GBP/JPY down 60 pips.
Analysis:
While it was a down week, it certainly reinforced the points that I made after reviewing the trades from last week. There, I noted how much support and resistance levels were affecting the market, and that my basic strategy wasn't working as well because nearly all of the charts of the pairs I'm trading had moved into areas with a lot of crossing support and resistance lines. My trades were bouncing off these lines left and right, and as I wasn't looking for it, I lost a lot of them.
This week, I decided not to change my basic strategy just yet, and to monitor the support and resistance lines to see if it would explain why my trades performed the way that they did.
Well, it did--surprisingly well, actually. Upon my review of my trades for the week, I only found one or two examples of trades that failed for a reason other than bouncing off of a support and resistance line. Monday, for example, was my worst day ever, down 180 pips, and I shouldn't have set up 7 out of the 8 trades I set up based on S/R levels. By the end of the week (Thursday and Friday), most of the pairs were moving out of the channel they went into early last week (i.e. less S and R lines around), and I was up 57 pips over those two days using just the basic strategy.
You can see a brief summary of all of my daily trades on my Daily Trades Spreadsheet. For this post, I'm going to run through an example of what I'm talking about above, going day by day using EUR/JPY as an example.
First, here's a 4-hour chart of how EUR/JPY looked coming into the week (the support and resistance lines were drawn from the daily chart...the light blue one is the strongest as it had been tested multiple times on both sides).
Now, the trades:
Monday 5/19:
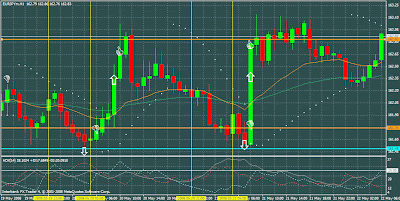
From the high and low of the 22:00 to 5:00 session (indicated between the yellow lines), the price only had less than 30 pips to move up before hitting resistance and less than 20 pips to move down to before hitting support, respectively. As you can see, price brokedown (at the white down arrow sign), came within a few pips of support, and turned around, making it back up to hit my stop loss (at the white thumbs-down sign). Down 30 pips on the day.
Tuesday 5/20:
Here, you can see the sell order should never have been placed, as the price was just about to the blue support line. It was tripped, the price turned around, and it hit my stop loss. The buy order, however, was correctly placed, as there was about 60 pips room up, and it hit the TP, as you can see. Up 15 pips on the day.
Wednesday 5/21:
As you can see, almost an exact repeat of the day before. Only the buy order should have been placed. Up 15 pips on the day.
Thursday 5/22:
Here we got lucky. The buy order was placed, though it shouldn't have been, and it did win, as price action broke through resistance. Note how long it took for it to finally break through though. The stop order was within a few pips of being tripped. A safer alternative to that trade would have been to place the buy entry a couple pips above the previous day's near double high of 163.14. This would have avoided the resistance line (and we would have been protected if price reversed), yet it still would have been more than sufficient to net us a TP of 45 pips. Up 45 pips on the day.
Friday 5/23:
Both buy and sell orders would have been fine to place, as there wasn't any resistance or support within 70 pips. As you can see, just the sell side was activated, and the price moved down nicely to activate the TP before hitting the support below. Up 45 pips on the day.
So, all of the above traded with the basic strategy put the EUR/JPY up 90 pips on the week. But, as you can see from the examples above, a little attention to support and resistance levels could have easily made that up 180 pips, doubling the profits for the week.
As I said before, EUR/JPY was just an example. Every pair would have benefited from this strategy...see my comments on my Daily Trades Spreadsheet to get an idea how.
So, how does this change the overall strategy?
Well, while I'm becoming quite convinced that respect for support and resistance levels must become a part of my final strategy, I'm not sure exactly how I'm going to implement it. This is because I'd like to come as close to a rule-based, mechanized system as possible. That makes it easier to back-test, easier to analyze, and most importantly, easier to implement. Nonetheless, this week, I'm going to deviate a bit from the basic strategy to place trades based more like what I talk about in this article. I'll still be keeping a keen eye on the performance of each trade and will report on the progress next week. In the interim, feel free to get brief updates in my comments on the spreadsheet.
Sunday, May 25, 2008
Trading Results, 5/19 - 5/23
Labels:
Analysis,
Results,
Strategy,
Support and Resistance
Subscribe to:
Post Comments (Atom)
No comments:
Post a Comment